Monday 17 August 2015
Breeding success in local nature reserve nestboxes 2014-15
These two parallel axes graphs are my first attempt at writing SVG files. The graphs show nesting success for Blue Tits and Great Tits in nest boxes at my local nature reserve - showing the number of eggs, how many of those hatched, and how many of those chicks fledged. The left hand graph shows results for 2014, the right 2015 (I'll label these later!). Lines with a steeper angle down show a lower success rate (often with a nest failure - where all chicks die before fledging); lines with a shallower angle or flat lines show a higher success rate with higher proportion of eggs hatching - chicks fledging. It should be clear that the 2014 breeding season was more successful overall than then 2015 season. I'll finish these off in a few days (2015 results not finalised yet)!
Monday 22 June 2015
Two gull migrations - visualised
Lifewatch INBO (Belgium) are monitoring Lesser Black-backed Gulls (Larus fuscus) using GPS 'backpacks' developed by the University of Amsterdam. They've already created some great visualisations, and data from previous years has been made available as open data, for others to explore.
In this visualisation, follow Gull 719 (aka "Harry") in red, and Gull 623 in blue, on their movements over one year. See below for how the map was made (although I'll probably keep tweaking it!). Full screen map here
I've used Leaflet to setup the map backdrop combining two different sources, then added two separate map visualisations already created within Cartodb by taking chunks of Lifewatch INBO's data. The visualisations are made using the Torque function. Using the visualisations loaded separately onto the backdrop map, I've got two Torque animations working at once in the same map, which isn't supported within Cartodb itself.
One problem - clicking the pause button only pauses one of the gulls! I'm going to keep tweaking it to improve..
Gull tracking data has been published to the Public Domain CC0 1.0.
Stienen E, Desmet P, Hernandez F, Bouten W, Lens L (2014): Bird tracking - GPS tracking of Lesser Black-backed Gull and Herring Gull breeding at the Belgian coast. v5.2. Research Institute for Nature and Forest (INBO). Dataset/Occurrence. http://doi.org/10.15468/02omly
Thursday 23 April 2015
Handy data sources for your maps
A couple of weeks ago I did a short talk at Maptime Southampton on useful data sources for your map content plus handy background mapping. Data.gov.uk has a huge amount of content but can be time consuming to sift through - so here's a few alternative sources for finding open data quickly.
Here's the slides - on Github Pages (as demonstrated by Nicholas Duggan during the same session!). Press the right arrow to scroll through the slides below.
Thursday 12 February 2015
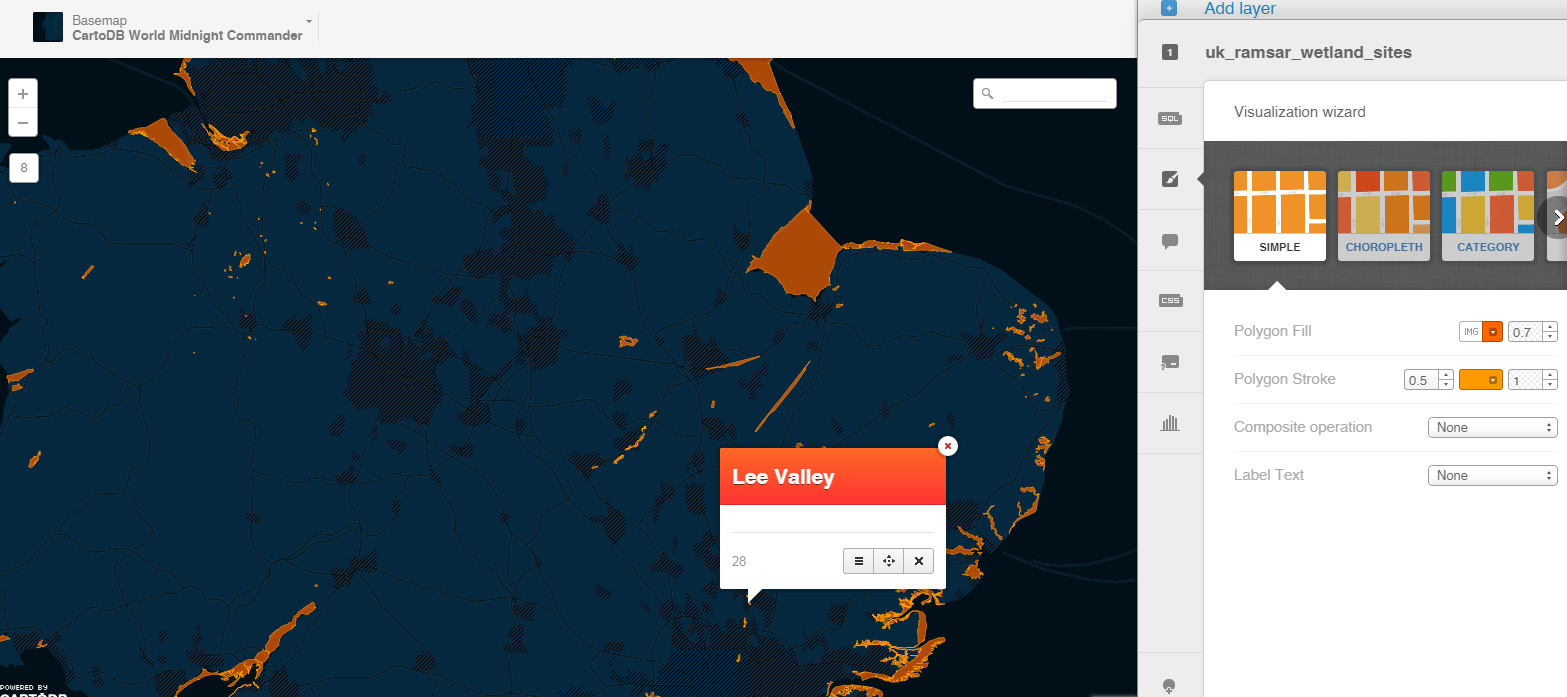
RAMSAR Sites in CartoDB
 |
| RAMSAR Sites in CartoDB |
 The birds: Given it was World Wetlands Day a couple of weeks ago I decided to see what there was in the way of online mapping of RAMSAR sites (sites designated as internationally important wetlands for wildlife). Wikipedia tells me that the RAMSAR Convention "is an international treaty for the conservation and sustainable utilization of wetlands recognizing the fundamental ecological functions of wetlands and their economic, cultural, scientific, and recreational value". Apparently it's named after the city in Iran where the treaty was signed - funny, I'd always thought it was some complicated acronym..
I'd found this interactive map (left) on the RAMSAR Sites Information Service website which gives comprehensive details on RAMSAR sites worldwide, with each site marked as a point. The page is very informative and contains all sorts of links on each site, but no site outlines.
The map: I fancied creating a simple map using CartoDB to show the actual outlines of the RAMSAR site in the UK to highlight their actual area of coverage. The (free) data is available in shapefile format from the JNCC website. Here we are only really concerned with the site locations and their coverage, I don't need to show any other detail on the map so no need for categorisation or colour coding. So I've picked a simple map backdrop colour scheme - CartoDB's wonderfully named "Midnight commander" dark blue theme - with a high contrast orange to allow the site outlines to stand out plus enable small sites to be picked out even when zoomed out. I've also enabled popups which show the site name, with one of CartoDB's standard popup background colours to (sort of) match the polygons. If I had the appropriate info I could also add some URLs to these popups linking to further information.
Method... Starting by opening the shapefile data in QGis, I had a look at what we were dealing with data-wise - the polygons were very complex and that level of detail would not be required for viewing on the web, besides there are limits on file sizes uploaded to CartoDB. Using QGis's Simplify Geometries tool (Vector menu - Geometry tools) allows you to generalise features within a file - I chose a Simplify Tolerance of 50 which stripped out the majority of the vertices within the polygons and thus really dropped down the file size, although you could barely notice the difference even when zoomed right in.
CartoDB accepts data in a range of formats, but not shapefile, so I then used QGis to convert my now slimmed down shapefile into one GeoJSON file. This was most of the work done now - once this file was ready and uploaded into CartoDB it was only going to be a few minutes' work to style it up using the tools on their interface.
Uploading the GeoJSON file presented the data in table form, but then clicking on Map View showed the polygons themselves on the default map backdrop. The styling involved just selecting from a range of base maps by clicking on the menu on the top left, followed by selecting a layer colour from the wizard tab on the right. Then Save and Create Visualisation and the map was ready to share.
The few forays I've had into CartoDB have shown it to be a joy to use once you've got your data ready - so simple! Looks like you get up to 50MB of storage so let's see how long the free subscription lasts me...
Wednesday 16 July 2014
Eric the Belgian crisp-loving gull gets mapped in CartodB
 |
| Peter Desmet's temporal map of Eric's movements |
I'd already had a brief look at CartodB to make my Shiants
seabird map and intend to explore it in more detail shortly, but in the
meantime, here's some fabulous examples of its use by researchers in Belgium who've been looking into foraging patterns of gulls since last
year. "Eric" the Lesser Black Backed Gull was fitted with a GPS
tracker and his movements tracked during the breeding season. In this post Peter Desmet - one of the researchers from LifewatchINBO - experiments with the data collected
from Eric's tracker.
The birds: Eric's
movements indicate he changed his foraging behaviour as the breeding season
progressed, with him spending the incubation period feeding inland on
agricultural land as well as on "discarded potato chips unfit for human
consumption" in a container in Moeskroen 65km away from his nest in Zeebrugge, and moving to foraging
at sea when his chicks were needing to be fed a higher energy diet.
The project is continuing with many more Lesser Black Backed
Gulls as well as Herring Gulls now being monitored. All their movements can be
viewed now - and you can see how some individuals appear to favour foraging at sea whilst others
far prefer to do all their foraging inland, with Moeskroen and its free reject crisps
being a favourite hangout.
The maps: Peter
Desmet has not only shown how he created 'routes' showing Eric's flight
patterns, but he also made use of CartodB's temporal mapping functionality to
show an animation of Eric's movement over a period of two months. I like the choice
of background colour too to highlight the data being showcased rather than the map.
I didn't think I had any tracking data to play with but
Peter's even kindly uploaded this data dedicated to the public domain, so
no excuse! I do have some ideas of how I could try some temporal maps using
data such as nesting dates for nest boxes, plus the cluster maps look pretty
straightforward. I'm looking forward to trying out CartodB myself!
Sunday 13 July 2014
Shiant Islands Seabird Recovery map - using Mangomap

The map: There's a variety of open source services offering the ability to host your own mapping online, all coming with different tools, background maps and payment plans aimed more at commercial use, with most offering entry level functionality with free access. For this first map I've had a play with Mangomap which has proven to be extremely easy to use, and I had my first map up and running within a few minutes. Looks like they have very good support too given the amount of friendly emails I've received since signing up! I simply uploaded a CSV containing all the recovery data plus decimal lat/lon coordinates for each recovery location; the only requirement for Mangomap to recognise the coordinates was for the column headers to be named lat and lon - no GIS required. The time is in getting all the data ready in your CSV first - eg links to photos etc. Admittedly the lines shown on the map required a bit more faffing prior to uploading, but were simple enough to create in shapefile format by converting WKT linestrings for each coordinate pair (ringing location and finding location) using QGIS.
Mangomap takes several input formats including CSV, SHP and KML/KMZ and allows you to customise the features on the map, although with the free version there's no way to turn on/off individual layers - it's all your layers or nothing. The additional tools you get if you pay include print-to-pdf and the ability to edit the data once it's uploaded, which saves having to edit and re-upload your CSV every time you want to make a change.
Mangomap takes several input formats including CSV, SHP and KML/KMZ and allows you to customise the features on the map, although with the free version there's no way to turn on/off individual layers - it's all your layers or nothing. The additional tools you get if you pay include print-to-pdf and the ability to edit the data once it's uploaded, which saves having to edit and re-upload your CSV every time you want to make a change.
Only one free map though - so maybe this will be it for my Mangomap trials? For this sort of ad hoc personal use I'd be willing to pay a small fee perhaps based on storage or a small annual charge, something more like you'd get with Flickr, but at $29pcm minimum spend this 'hobby mapper' won't be tempted to sign up yet!
Subscribe to:
Posts (Atom)